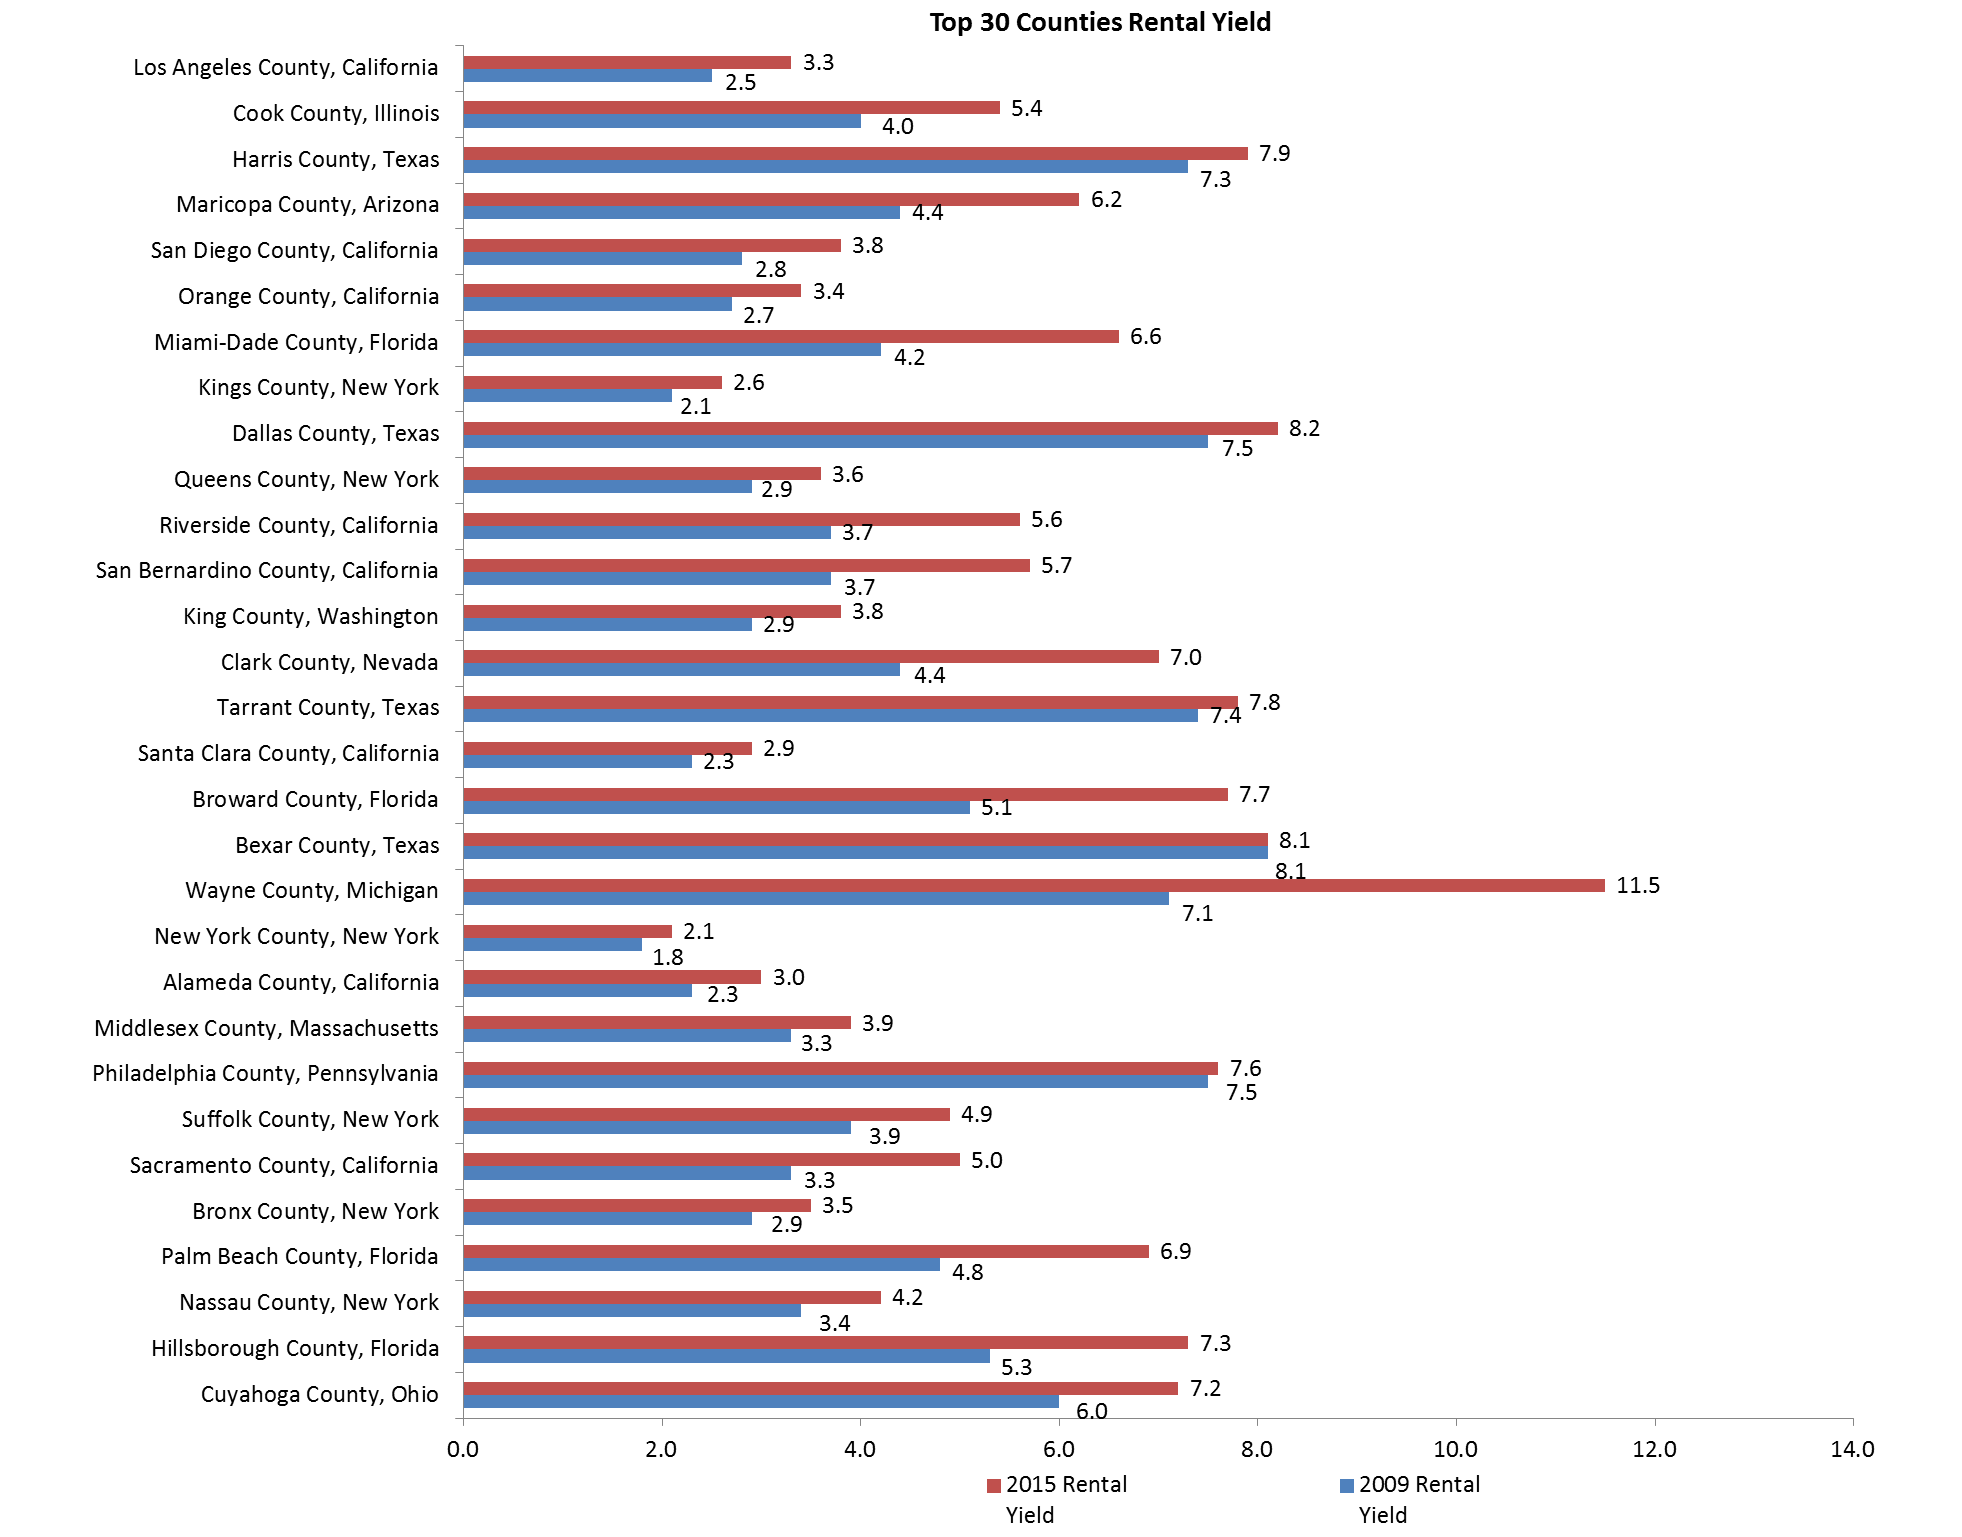
29 out of the Top 30 Most Populated Counties Experienced an Increase in Rental Yield from 2009 to 2015
Gavop’s study shows that rental yield increased by 0.9 percent from 2009 to 2015 in the United States. The top most populated counties in the U.S. experienced a similar increase in rental yield ranging from 0.8 percent to 2.6 percent increase.
Rental yield is a term used to describe the rate of income return over the cost associated with a property. Analysts from Gavop used information from the United States Census Bureau to examine rental yield as a way to look at U.S. housing market trends. There was a rental yield increase in many parts of the U.S. because more people rented instead of purchased homes and the overall value of homes have fallen. From 2009 to 2015, national home values decreased by 3.7 percent while the median gross rent increased by 13.6 percent.
The contrast in home values to median rent values is what allowed for property owners to increase their rental yields. An increase in rental yield means that those who owned and rented out property have increased their rate of income return over the cost of owning and maintaining a property. In other words, property owners have been able to increase their revenue.
The following data table shows the top 30 most populated counties in the United States by an increase in rental yield. It is important to note how rent increased at a higher rate than home values.
| County | 2015 Housing Units | 2015 Population | Median Gross Rent Percentage Change Latest to Earliest | Home Value Percentage Change Latest to Earliest | 2015 Rental Yield | 2009 Rental Yield | 2015 - 2009 Rental Yield change |
|---|---|---|---|---|---|---|---|
| United States | 133351840 | 316515021 | 13.6 | -3.7 | 6.2 | 5.3 | 0.9 |
| Los Angeles County, California | 3476718 | 10038388 | 14.4 | -15.3 | 3.3 | 2.5 | 0.8 |
| Cook County, Illinois | 2176549 | 5236393 | 11.1 | -18.2 | 5.4 | 4 | 1.4 |
| Harris County, Texas | 1660235 | 4356362 | 14 | 5.9 | 7.9 | 7.3 | 0.6 |
| Maricopa County, Arizona | 1668555 | 4018143 | 8.2 | -23.1 | 6.2 | 4.4 | 1.8 |
| San Diego County, California | 1180806 | 3223096 | 12.2 | -16.8 | 3.8 | 2.8 | 1 |
| Orange County, California | 1064642 | 3116069 | 10.7 | -11.5 | 3.4 | 2.7 | 0.7 |
| Miami-Dade County, Florida | 998833 | 2639042 | 15.2 | -26.7 | 6.6 | 4.2 | 2.4 |
| Kings County, New York | 1017282 | 2595259 | 24.4 | 4.2 | 2.6 | 2.1 | 0.5 |
| Dallas County, Texas | 964713 | 2485003 | 12.1 | 3 | 8.2 | 7.5 | 0.7 |
| Queens County, New York | 844189 | 2301139 | 20.3 | -4.3 | 3.6 | 2.9 | 0.7 |
| Riverside County, California | 815322 | 2298032 | 8.7 | -28.8 | 5.6 | 3.7 | 1.9 |
| San Bernardino County, California | 705962 | 2094769 | 7.4 | -30 | 5.7 | 3.7 | 2 |
| King County, Washington | 871836 | 2045756 | 24.8 | -3.6 | 3.8 | 2.9 | 0.9 |
| Clark County, Nevada | 857131 | 2035572 | -2.4 | -38.8 | 7 | 4.4 | 2.6 |
| Tarrant County, Texas | 732985 | 1914526 | 12.7 | 7.2 | 7.8 | 7.4 | 0.4 |
| Santa Clara County, California | 646190 | 1868149 | 25 | -0.8 | 2.9 | 2.3 | 0.6 |
| Broward County, Florida | 814454 | 1843152 | 7.2 | -28.6 | 7.7 | 5.1 | 2.6 |
| Bexar County, Texas | 675208 | 1825502 | 18.5 | 18 | 8.1 | 8.1 | 0 |
| Wayne County, Michigan | 817593 | 1778969 | 6.4 | -33.8 | 11.5 | 7.1 | 4.4 |
| New York County, New York | 862289 | 1629507 | 26 | 6 | 2.1 | 1.8 | 0.3 |
| Alameda County, California | 589858 | 1584983 | 17.2 | -10.5 | 3 | 2.3 | 0.7 |
| Middlesex County, Massachusetts | 617089 | 1556116 | 12.6 | -3 | 3.9 | 3.3 | 0.6 |
| Philadelphia County, Pennsylvania | 670229 | 1555072 | 15.1 | 12.7 | 7.6 | 7.5 | 0.1 |
| Suffolk County, New York | 570194 | 1501373 | 10 | -12.8 | 4.9 | 3.9 | 1 |
| Sacramento County, California | 560271 | 1465832 | 7.5 | -28.4 | 5 | 3.3 | 1.7 |
| Bronx County, New York | 520329 | 1428357 | 21.4 | -1.7 | 3.5 | 2.9 | 0.6 |
| Palm Beach County, Florida | 671317 | 1378806 | 5.3 | -26.5 | 6.9 | 4.8 | 2.1 |
| Nassau County, New York | 467256 | 1354612 | 14.8 | -9 | 4.2 | 3.4 | 0.8 |
| Hillsborough County, Florida | 549024 | 1302884 | 8.5 | -20.6 | 7.3 | 5.3 | 2 |
| Cuyahoga County, Ohio | 619303 | 1263189 | 6.6 | 10.4 | 7.2 | 6 | 1.2 |