Home Purchase Approval Rates are 52.1 Percent Higher than Refinance and Home Improvement Loan Approval Rates in Houston, TX
By: Ramu Garuda July. 26, 2018
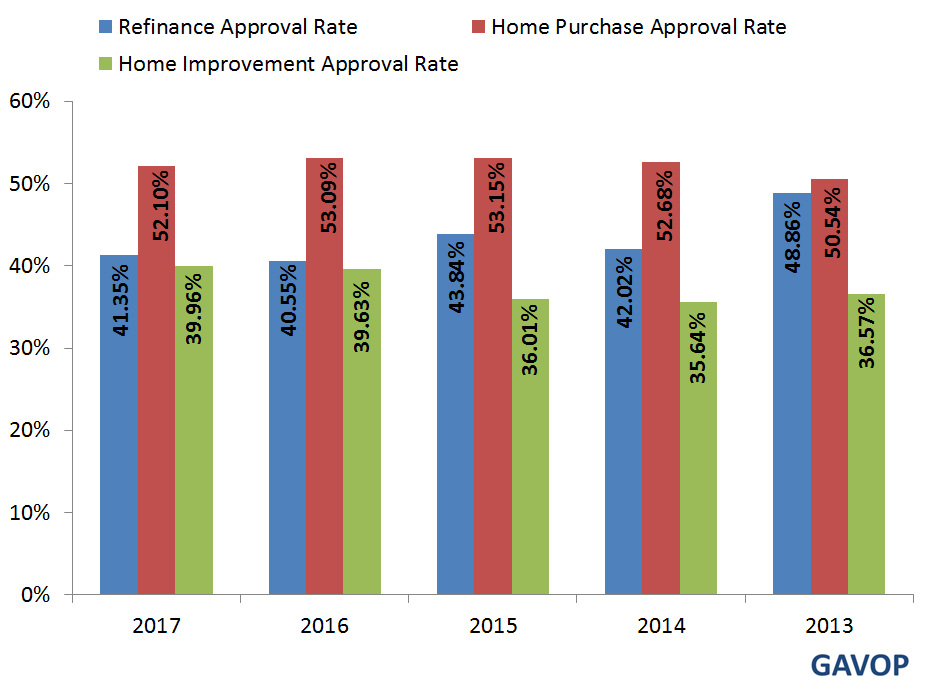
Loan approval rates issued for the purchase of a new home are higher than those for refinance and home improvement loans in Houston, Texas. In 2017, 52.10% of approvals were for home purchase loans, while 41.35% approvals were for refinance loans and 39.9% for home improvement loans.
These data were revealed in one of Gavop’s latest studies, using statistics from the Home Mortgage Disclosure Act (HMDA). The study examined approval rates in Houston between 2013 and 2017 and found that home purchase loan approvals outperformed refinance and home improvement loan approvals each year.
Compared to national values, refinance loan and home purchase loan approval rates were up to 10% lower than the national values between 2013 and 2017. During the same period, home improvement loan approvals were over 10% less than the national figures. This means that Houston has below average approval rates compared to the national standard rates.
The approval rate for refinancing loans decreased by around 7% in 2017 compared to the 2013 rate. From 2013 onward, approval rates for home purchase loans were consistently higher than those for other loans. The second highest approval rates were for refinance loans, followed by those for home improvement rates.The following graph shows the level of approval rates for each loan type over the five-year period.
Approval Rates Based on Loan Category
Additionally, Gavop studied loan originations for this city. In the last five years, 2013 saw the largest number of loan applications, while 2017 had the lowest number. The following table compares total loan applicants to total loan originations. In most cases, loan originations refer to all the steps taken by a lender after an application, and up to the point of fund disbursal.
Total Loan Applicants and Originations by Year in Houston, TX
| 2017 | 2016 | 2015 | 2014 | 2013 | |
|---|---|---|---|---|---|
| Total Loan Applicants | 95635 | 111954 | 103722 | 95876 | 119312 |
| Total Loan Originations | 45793 | 52657 | 50228 | 46042 | 58605 |
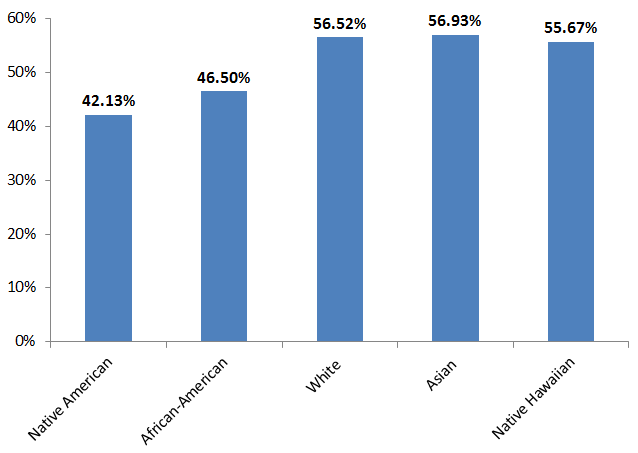
Looking at the total number of approved loans in 2017, the approval rates can be categorized by race. The majority of approvals were issued to Asians; 56.93% percent of all Asian applications were approved. Whites had the second highest approval rate in 2017, at 56.52%, followed by Native Hawaiians at 55.67%, African-Americans at 46.50%, and Native Americans at 42.13%
2017 Loan Approval Rates by Race
Further, when approval rates were examined on the basis of gender, the study found that men received higher approval rates than women did each year between 2013 and 2017.
Total Loan Approval Rates by Gender
| 2017 | 2016 | 2015 | 2014 | 2013 | |
|---|---|---|---|---|---|
| Male | 54.55% | 52.99% | 55.12% | 54.75% | 55.27% |
| Female | 51.86% | 49.54% | 51.79% | 50.81% | 51.47% |
ABOUT THE AUTHOR

Ramu Garuda
Ramu is a research analyst with over 9 years of analytics & research experience. Prior to joining the company, he worked with some of the prominent consulting and market research firms in India, including Pride Technology (Supporting consulting projects to PWC), RR Donnelly, and The Hackett Group. His skills include company profiling, benchmarking, data and trend analysis, industry analysis, and report writing across the industries. Ramu holds a Master’s degree in Finance and Marketing. He also has a bachelor’s degree in Biotechnology.