Are Mortgaged Homes A Sign of High Income in New York?
By: Ramu Garuda June. 07, 2018
Most of the mortgaged homes in New York belong to households that have an annual income of over $100,000. In fact, the number of mortgaged homes belonging to households in this income category has increased from 2009 to 2016 while mortgaged homes for household incomes of under $50,000 and incomes between $50,000 and $100,000 have decreased.
This came to light during a recent study by Gavop on county-level real estate data in New York. Statistics from the U.S. Census Bureau showed that as of 2016, 51.41 percent of households that earned over $100,000 had mortgage on their homes. In 2009, this number was at 41.82 percent. The following table shows how high-income mortgaged homes compare to the mortgaged homes for households of lower-income.
Percentage of Mortgaged Homes by Household Income 2009 and 2016
| Location | <$50,000 in 2009 | $50,000 - $100,000 in 2009 | >$100,000 in 2009 | <$50,000 in 2016 | $50,000 - $100,000 in 2016 | >$100,000 in 2016 |
|---|---|---|---|---|---|---|
| New York | 22.0% | 36.18% | 41.82% | 18.13% | 30.45% | 51.41% |
| United States | 29.16% | 38.81% | 32.02% | 23.28% | 34.52% | 42.1% |
The percentage of mortgaged homes varies by the level of household income, and homes with high incomes are more likely to have a mortgage. New York follows the national trend of a decrease in the proportion of mortgaged homes for households with an annual income of less than $50,000 and incomes between $50,000 and $100,000.
In New York, in three of the five most populated counties, over half of all the households with an income greater than $100,000 had mortgages. New York County has the highest percentage of mortgaged homes in this income level: 77.44 percent. The second highest percentage is in Suffolk County at 62.14 percent, followed by Kings County at 52.62 percent, Queens County at 48.85 percent, and, lastly, Bronx County at 43.79 percent.
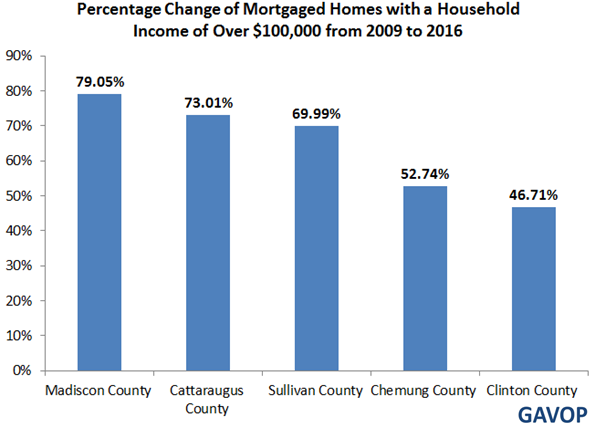
The data shows that the highest increase in mortgaged homes within the high-income level between 2009 and 2016 was in Madison County, at 79.05 percent. The next highest increase was in Cattaraugus County at 73.01 percent followed by Sullivan County at 69.99 percent, Chemung County at 52.74 percent, and Clinton County at 46.71 percent.
The percentage of mortgaged homes in households with income under $50,000 showed a -0.65 percent decrease in the Bronx and a -12.78 percent decrease in Orange County. Among households with incomes between $50,000 and $100,000, the percentage of mortgaged homes increased showed a 7.07 percent increase in Tompkins County and a -12.39 percent decrease in Wayne County.
ABOUT THE AUTHOR

Ramu Garuda
Ramu is a research analyst with over 9 years of analytics & research experience. Prior to joining the company, he worked with some of the prominent consulting and market research firms in India, including Pride Technology (Supporting consulting projects to PWC), RR Donnelly, and The Hackett Group. His skills include company profiling, benchmarking, data and trend analysis, industry analysis, and report writing across the industries. Ramu holds a Master’s degree in Finance and Marketing. He also has a bachelor’s degree in Biotechnology.