Why You Should Always Get Multiple Home Insurance Quotes and Compare
May. 16, 2018
Home insurance is one of those expenses that can feel mysterious. There are vague rules like “$3.50 a year for every $1,000 of home value”, but they vary considerably from city to city. It’s hard to get an intuitive sense of what “good” or “bad” home insurance prices are.
So, when you get a quote, it’s tempting to just take the first offer you get. Compared to the sticker shock of the house itself, the number might feel like small change. After all, it’s the same house no matter who you get insurance from, so it can’t matter too much who you ask -- right?
To investigate, we analyzed home insurance filing data from various insurers in twelve states to see how much the quotes differed for similar levels of coverage. Then, we grouped those quotes by location (generally county) and all locations with at least ten quotes were analyzed. The difference between the 75th percentile of premiums for a location and the 25th percentile of premiums was used to measure how much quotes could vary for the same location and coverage.
We found that the difference between the premiums was substantial, and shopping around can lead to dramatic changes in pricing. Of all the states we looked at, Texas had the biggest discrepancy in prices -- there was a $2,182 range in insurance prices between a 25th and 75th percentile quote. Even at the low end, in New Hampshire the price ranges between quotes at these percentiles was $363 per year.
We also did a detailed analysis of California home insurance quotes. In most notable cities in the state, after controlling for every single variable, there was a $300-500 price range between a 25th and 75th percentile quote for the same kind of house.
To start, let’s look at all of the quotes for yearly premiums for home insurance with coverage between $150,000 and $350,000. This lets us get a high-level overview of which states have the largest difference between the cheap premiums (the 25th percentile) and expensive premiums (the 75th percentile).
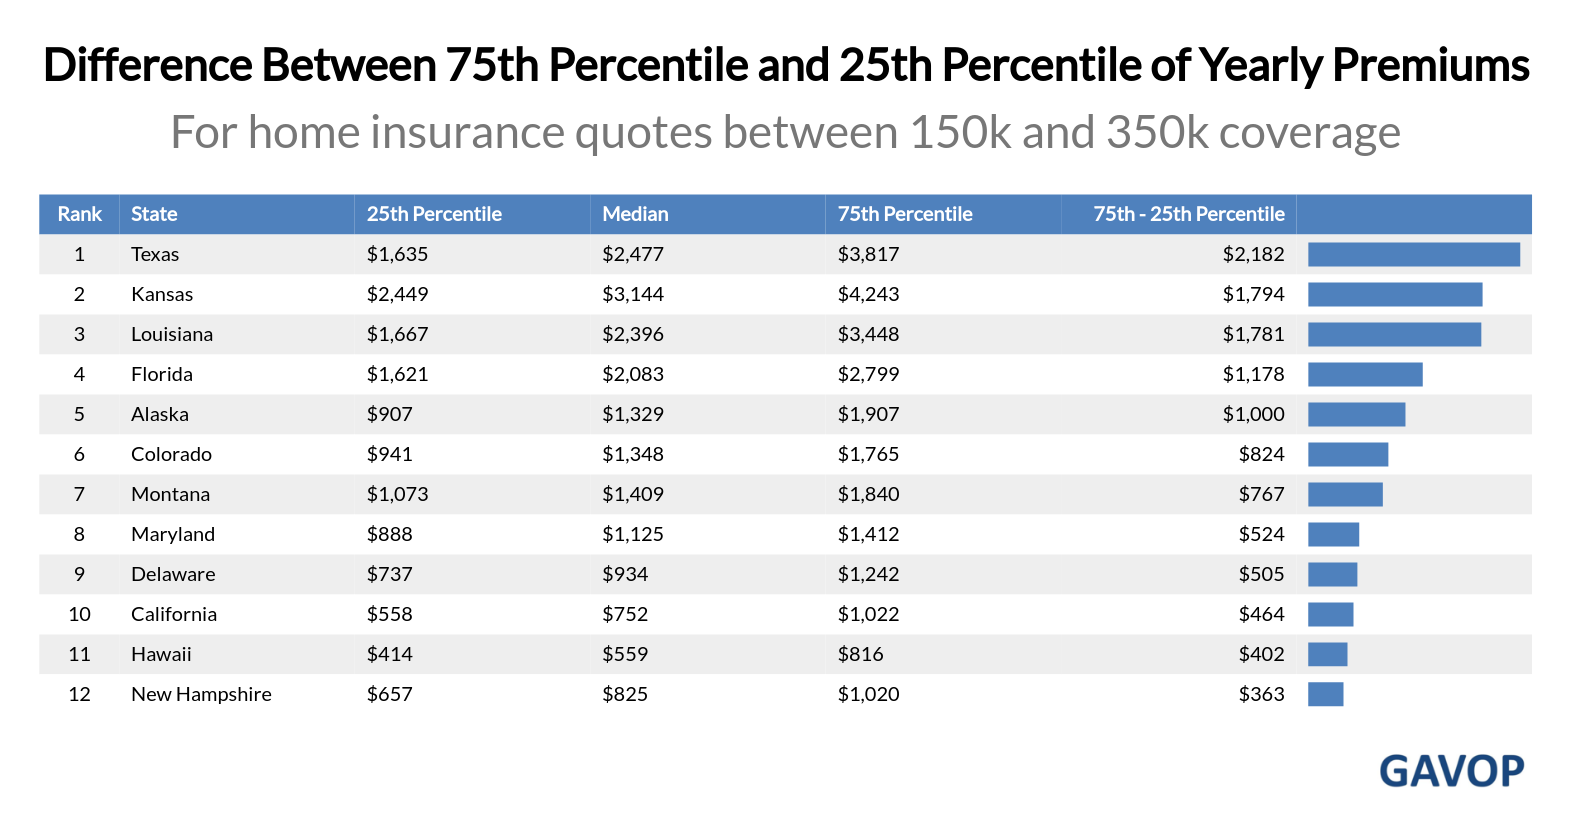
Generally speaking, the more expensive premiums are in an area, the greater the difference between cheap plans and expensive plans. In Texas, for example, even the 25th percentile of premiums ($1,635) is more than the 75th percentile of premiums in New Hampshire ($1,020). And the Texan 75th percentile is $3,817, making the difference between them a whopping $2,182! In other words, in Texas, you can reasonably expect shopping around to save you more on home insurance than people in many states even pay.
We can see this trend in more detail by looking at the locations in the dataset with the largest difference between the 75th and 25th percentiles. These are areas where shopping around can have an extremely dramatic difference. Note here that we’re defining “low” coverage as $150,000 or less, “medium” coverage as greater than $150,000 but less than or equal to $350,000, and “high” coverage as anything greater than $350,000.
Highest Differences Between Quotes Per Location
From sample of quotes for that location, controlling for coverage value
| Rank | Location | State | Coverage | 25th Percentile | Median | 75th Percentile | 75th - 25th Percentile |
|---|---|---|---|---|---|---|---|
| 1 | Nueces | Texas | Medium | $1,478 | $3,550 | $6,658 | $5180 |
| 2 | Monroe County | Florida | Low | $2,211 | $4,011 | $7,100 | $4889 |
| 3 | Cameron | Louisiana | High | $5,279 | $7,040 | $10,163 | $4884 |
| 4 | Galveston | Texas | Medium | $1,101 | $2,882 | $5,817 | $4716 |
| 5 | Chambers | Texas | Medium | $1,278 | $3,007 | $5,989 | $4711 |
| 6 | Aransas | Texas | Medium | $1,166 | $2,808 | $5,742 | $4576 |
| 7 | Chalmette | Louisiana | High | $3,546 | $4,579 | $7,931 | $4384 |
| 8 | Calhoun | Texas | Medium | $1,103 | $2,807 | $5,250 | $4147 |
| 9 | Refugio | Texasee | Medium | $1,135 | $2,681 | $4,975 | $3841 |
| 10 | San Patricio | Texas | Medium | $1,065 | $2,647 | $4,896 | $3831 |
| 11 | Kenner | Louisiana | High | $3,811 | $4,737 | $7,382 | $3571 |
| 12 | Miami-dade County | Florida | Low | $3,483 | $4,476 | $7,025 | $3542 |
| 13 | Cameron | Louisiana | Medium | $3,825 | $5,470 | $7,362 | $3537 |
| 14 | Metairie | Louisiana | High | $3,784 | $4,470 | $7,237 | $3453 |
| 15 | Jefferson | Texas | Medium | $1,134 | $2,477 | $4,552 | $3418 |
| 16 | Brazoria | Texas | Medium | $1,069 | $2,410 | $4,423 | $3354 |
| 17 | Irion | Texas | Medium | $1,973 | $3,299 | $5,288 | $3315 |
| 18 | Willacy | Texas | Medium | $1,080 | $2,179 | $4,316 | $3237 |
| 19 | Houma | Louisiana | High | $3,797 | $5,275 | $7,006 | $3209 |
| 20 | Cameron | Texas | Medium | $973 | $2,071 | $4,135 | $3162 |
| 21 | Thibodaux | Louisiana | High | $3,076 | $4,235 | $6,238 | $3162 |
| 22 | New Orleans | Louisiana | High | $4,176 | $5,030 | $7,306 | $3130 |
| 23 | Borden | Texas | Medium | $2,096 | $3,347 | $5,183 | $3087 |
| 24 | Broward County | Florida | Low | $2,545 | $3,699 | $5,618 | $3073 |
| 25 | Kent | Texas | Medium | $2,096 | $3,276 | $5,050 | $2954 |
You can see that no median price was less than $2,000, and that it’s mostly high coverage plans that are represented. The largest one, Nueces County (which includes Mustang Island, an extreme flood risk) had differences of over $5,000! They are also all in Texas, Florida, and Louisiana - three of the four most expensive states in our data set. (The area with the biggest difference in Kansas is Gove County at $2,090).
Next, let’s look at the locations with the smallest variation. These are ones where shopping around would have the least impact, because plans really are mostly the same.
Lowest Differences Between Quotes Per Location
From sample of quotes for that location, controlling for coverage value
| Rank | Location | State | Coverage | 25th Percentile | Median | 75th Percentile | 75th - 25th Percentile |
|---|---|---|---|---|---|---|---|
| 1 | Missoula | Montana | Low | $180 | $194 | $277 | $97 |
| 2 | Billings | Montana | Low | $176 | $198 | $280 | $104 |
| 3 | Kalispell | Montana | Low | $160 | $185 | $268 | $108 |
| 4 | Bozeman | Montana | Low | $148 | $180 | $258 | $110 |
| 5 | Helena | Montana | Low | $166 | $186 | $278 | $112 |
| 6 | Greatfalls | Montana | Low | $177 | $190 | $291 | $114 |
| 7 | Glendive | Montana | Low | $168 | $199 | $282 | $114 |
| 8 | Butte | Montana | Low | $159 | $194 | $277 | $119 |
| 9 | Scobey | Montana | Low | $157 | $199 | $307 | $150 |
| 10 | Allegany | Maryland | Medium | $696 | $805 | $922 | $226 |
| 11 | Baltimore | Maryland | Medium | $828 | $983 | $1,068 | $240 |
| 12 | Allegany | Maryland | Low | $521 | $610 | $763 | $242 |
| 13 | Garrett | Maryland | Low | $612 | $696 | $889 | $277 |
| 14 | St. Johns County | Florida | Medium | $1,390 | $1,568 | $1,678 | $289 |
| 15 | Washington | Maryland | Medium | $813 | $943 | $1,106 | $293 |
| 16 | Garrett | Maryland | Medium | $677 | $814 | $973 | $296 |
| 17 | Baltimore County | Maryland | High | $1,073 | $1,223 | $1,371 | $298 |
| 18 | Lebanon | New Hampshire | Medium | $694 | $855 | $1,012 | $318 |
| 19 | Dover | Delaware | Low | $382 | $546 | $705 | $323 |
| 20 | Somerset | Maryland | Low | $729 | $861 | $1,060 | $332 |
As we can see, the plans are much more likely to be low coverage, and the median premiums are much smaller. Missoula, the lowest difference location in our whole data set, is a great example of how the premiums being low forces the difference to be low. Since your insurance costs won’t be negative, there’s simply no way for the high and low end to vary that much when the plans are all so cheap.
To get an even better view of this trend, we can look at a plot of the median premium for a given location and level of coverage against the difference between the 75th and 25th percentile of premiums for that location and level of coverage. This will allow us to see what happens to the differences as the median increases.
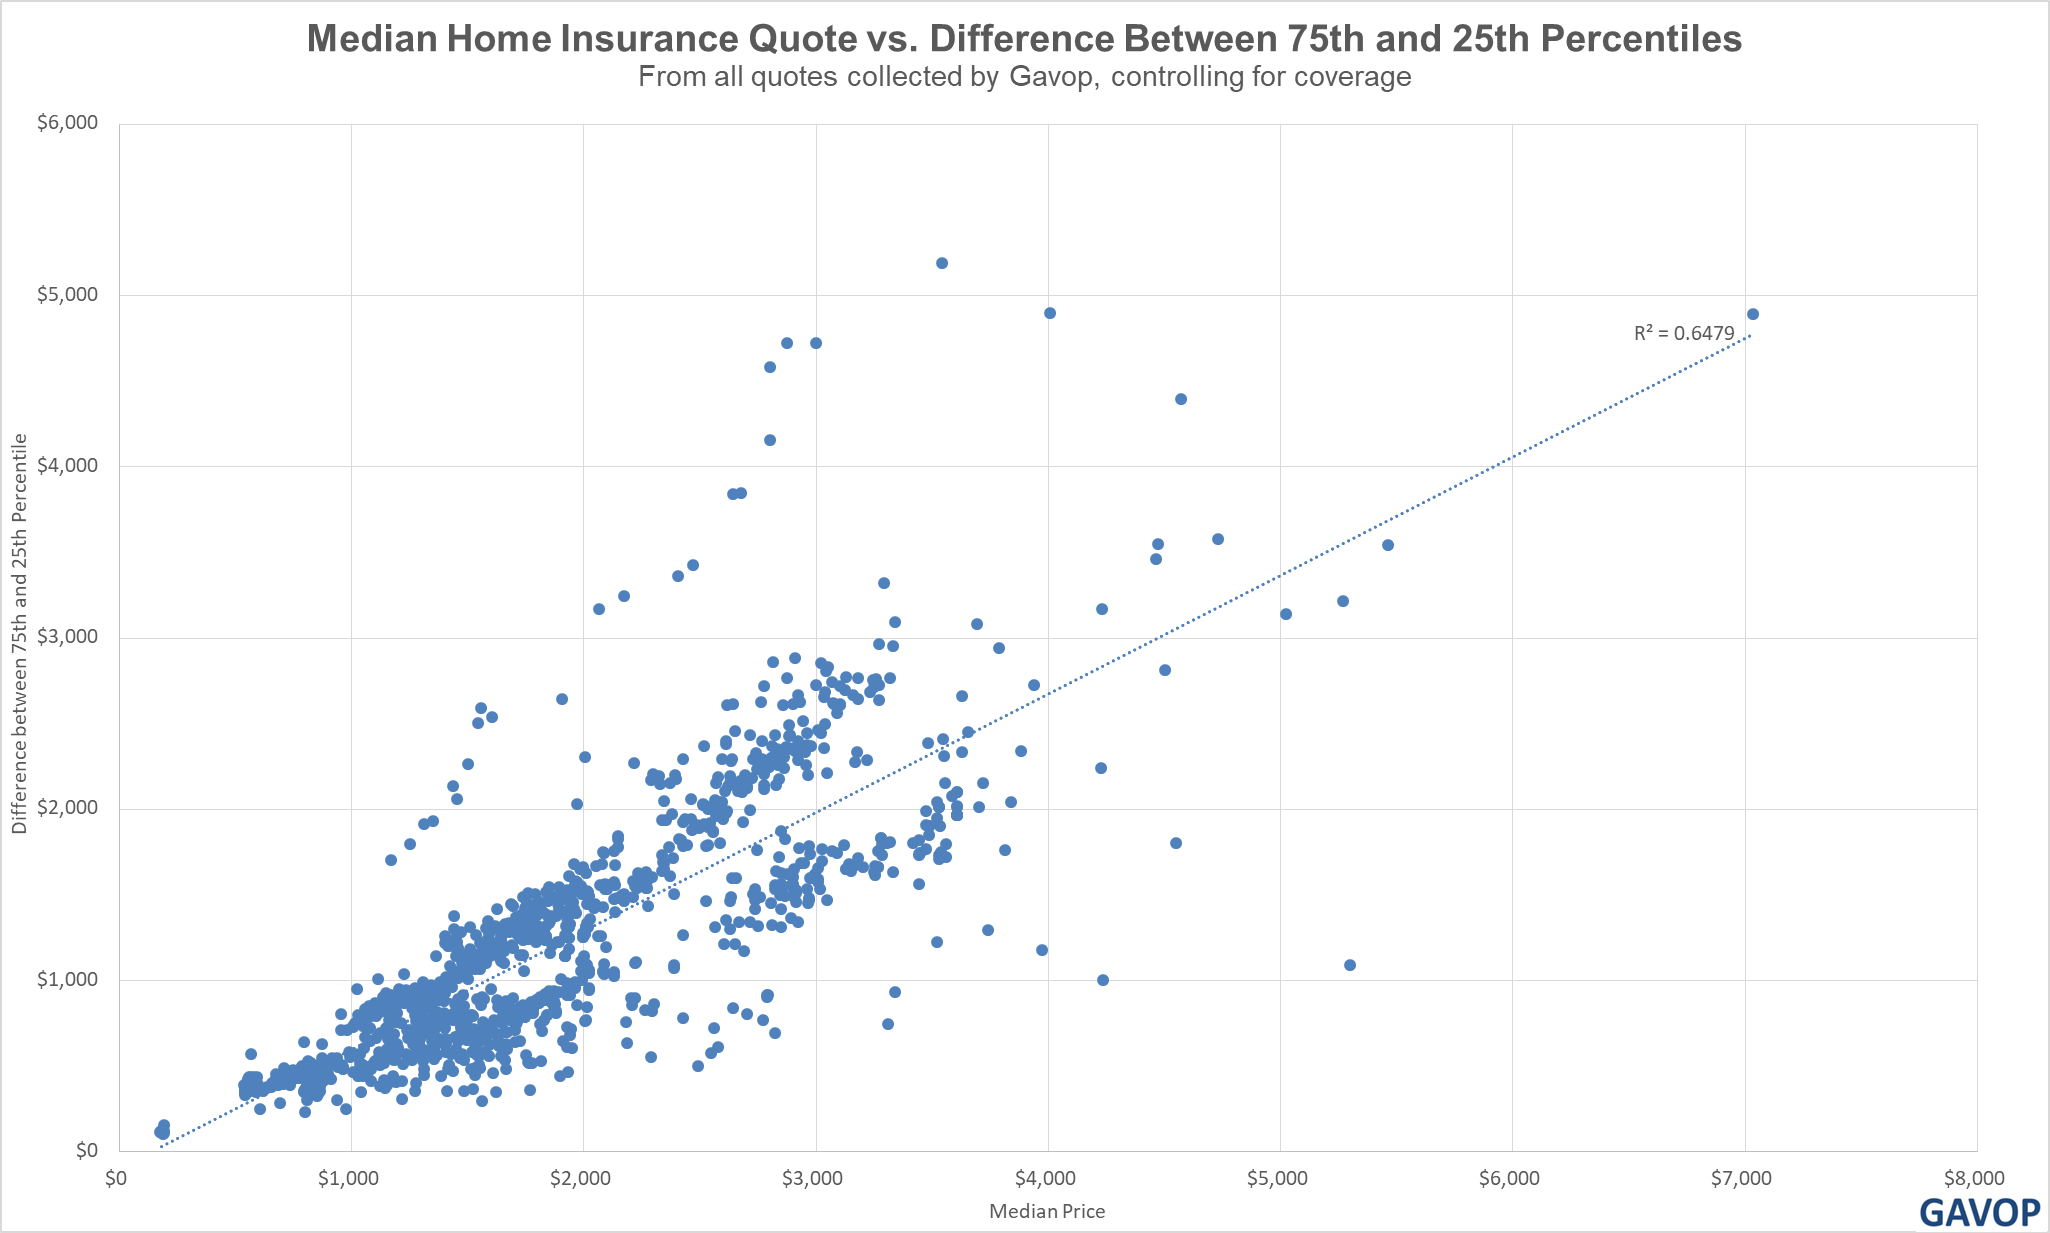
For every $1,000 increase in median price, you can expect the difference between the cheap and expensive quotes to increase by around $700. If the median premium is $1,000, the plans will likely all have fairly similar premiums. But for a median premium of $6,000, you could save $4,000 by just shopping around!
Now, let’s turn to look at California specifically. By limiting our investigation to a single state, we can control for all factors and look at the differences in quotes for truly identical criteria. Let’s dig into the difference between the 75th and 25th percentile of yearly premiums for some California cities:
Average Premium Difference In Selected Californian Cities
From sample of quotes for that location, controlling for all criteria
| Rank | City Name | 25th Percentile | Median | 75th Percentile | 75th - 25th Percentile |
|---|---|---|---|---|---|
| 1 | San Francisco | $884 | $1,121 | $1,409 | $525 |
| 2 | Los Angeles | $852 | $1,063 | $1,364 | $512 |
| 3 | Contra Costa | $735 | $926 | $1,162 | $426 |
| 4 | Fresno | $862 | $1,047 | $1,271 | $409 |
| 5 | San Mateo | $748 | $925 | $1,140 | $391 |
| 6 | San Diego | $767 | $936 | $1,157 | $389 |
| 7 | Santa Clara | $724 | $890 | $1,094 | $370 |
| 8 | Santa Cruz | $780 | $934 | $1,145 | $366 |
| 9 | Santa Barbara | $669 | $830 | $1,020 | $351 |
San Francisco is a city infamous for high housing prices, so it should come as no surprise that it’s top of the charts. However, it’s interesting that the differences are relatively constrained here. It appears that California is a more “fair” state where differences in insurance premiums are lessened - so even though the more expensive locations still have more variation, the variation is just lower across the board.
We can contrast that with data from Texas. Note that the Texas data is partitioned by zip code, not city, although we’ve included the city the zip code resides within:
Average Premium Difference In Selected Texan Zip Codes
From sample of quotes for that location, controlling for all criteria
| Rank | Zip Code | City Name | 25th Percentile | 75th Percentile | 75th - 25th |
|---|---|---|---|---|---|
| 1 | 78521 | Brownsville | $1,643 | $4,492 | $2848 |
| 2 | 77584 | Pearland | $2,307 | $4,950 | $2642 |
| 3 | 77705 | Port Arthur | $2,415 | $4,870 | $2455 |
| 4 | 76904 | San Angelo | $1,447 | $3,200 | $1753 |
| 5 | 78572 | Mission | $1,579 | $3,265 | $1686 |
| 6 | 76308 | Wichita Falls | $1,703 | $3,216 | $1513 |
| 7 | 79109 | Amarillo | $1,826 | $3,275 | $1449 |
| 8 | 79705 | Midland | $1,611 | $2,987 | $1376 |
| 9 | 79424 | Lubbock | $1,560 | $2,923 | $1362 |
| 10 | 79762 | Odessa | $1,594 | $2,884 | $1289 |
| 11 | 79605 | Abilene | $1,464 | $2,708 | $1243 |
| 12 | 76063 | Arlington | $1,728 | $2,834 | $1105 |
| 13 | 75217 | Dallas | $1,612 | $2,716 | $1104 |
| 14 | 76028 | Fort Worth | $1,560 | $2,663 | $1103 |
| 15 | 76706 | Waco | $1,296 | $2,397 | $1100 |
| 16 | 75067 | Lewisville | $1,386 | $2,404 | $1017 |
| 17 | 77386 | Houston | $1,447 | $2,457 | $1009 |
| 18 | 75070 | McKinney | $1,451 | $2,459 | $1007 |
| 19 | 76549 | Killeen | $1,094 | $2,002 | $907 |
| 20 | 75604 | Longview | $1,316 | $2,219 | $903 |
| 21 | 75165 | Waxahachie | $1,391 | $2,265 | $873 |
| 22 | 75703 | Tyler | $1,379 | $2,226 | $846 |
| 23 | 78228 | San Antonio | $1,154 | $1,904 | $750 |
| 24 | 77840 | College Station | $1,106 | $1,838 | $731 |
| 25 | 79936 | El Paso | $830 | $1,474 | $643 |
It’s night and day between California and Texas. Texas is one of the most expensive states to get home insurance in the country, owing partly to the frequency of catastrophic weather events and partly due to higher insurer expenses. Not only does zip code 78521 in Brownsville have a 25th percentile of premium greater than San Francisco's 75th percentile, but it’s 75th percentile is more than double that!
Turning back to California, let’s find the same trend line we originally found for the whole dataset:
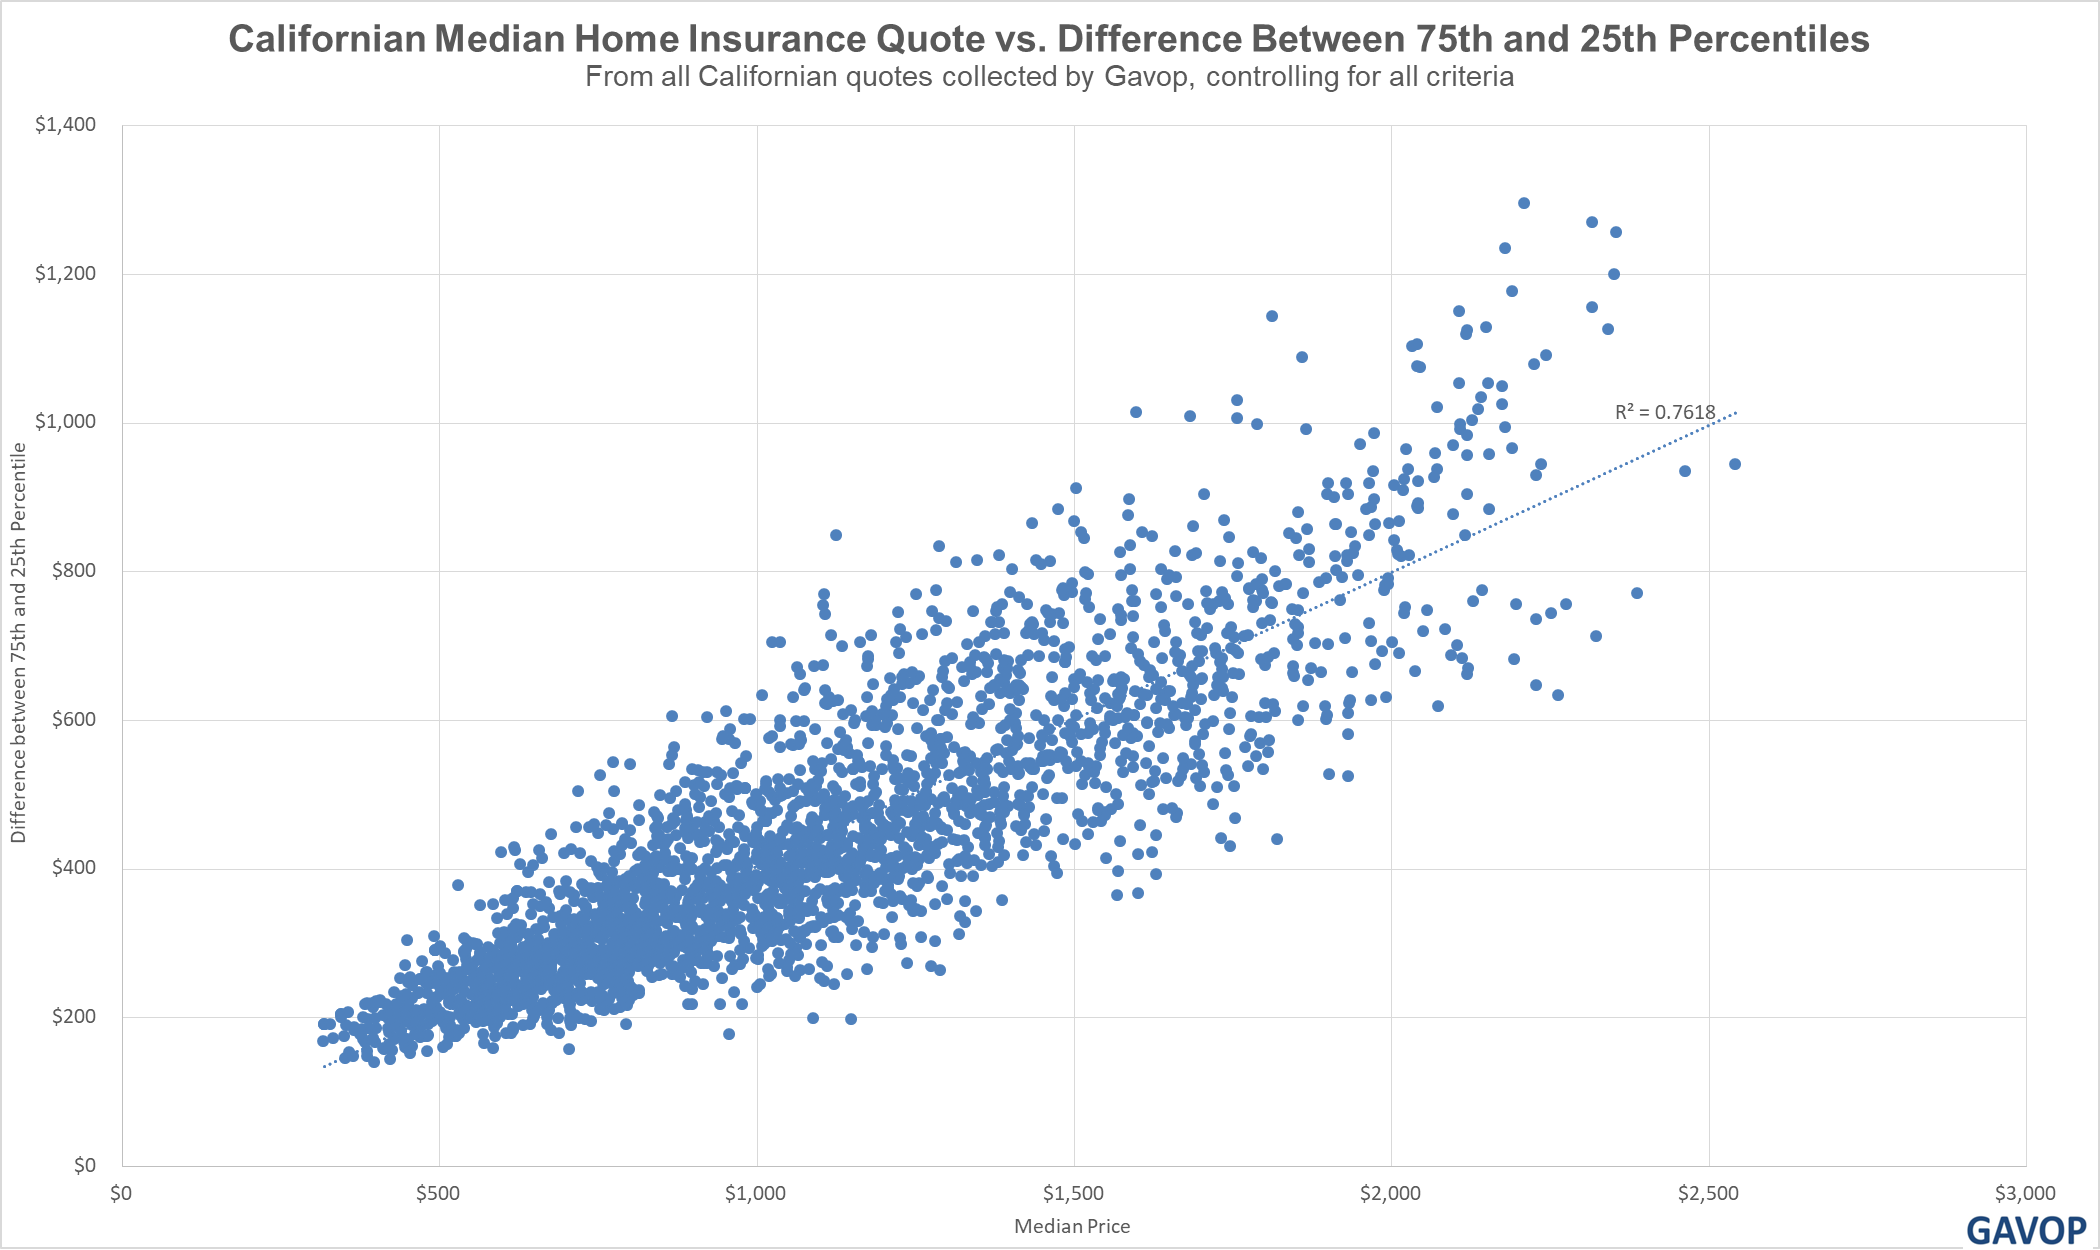
This trendline has a higher R2 than the national one - it’s even more likely that a higher median premium means more variation. However, the degree of that variation is lessened. In California, for every $1,000 increase in medium premium, the difference between the 75th and 25th percentile of premiums increases by just $400. (This is the measure of “fairness” for a state).
We can see this in more detail by viewing the data with a stacked area chart. In this kind of chart, we draw a line to show how many of the locations controlling for all criteria had differences no more than a certain value. So, the halfway point on the X-axis (denoted here with a red line) shows the value of difference of the median location, and half of the locations had a difference less than that.
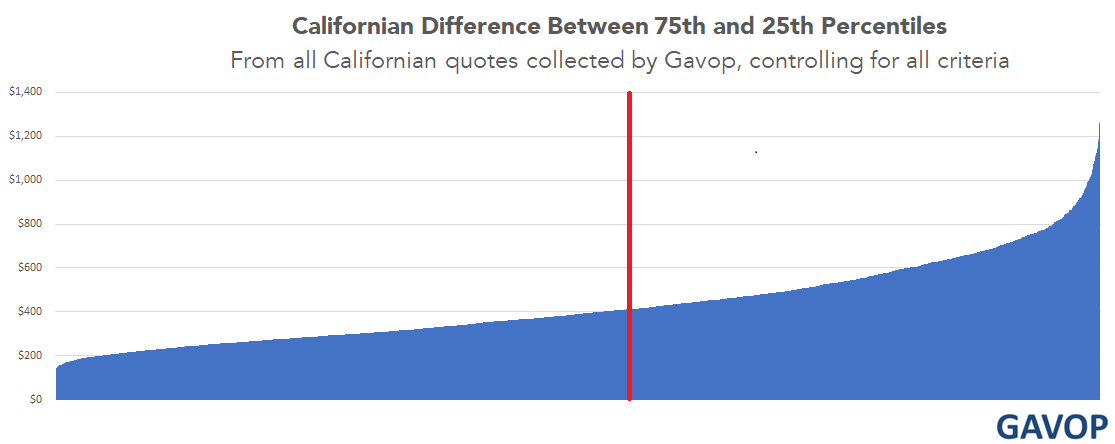
We can see that the halfway point is only $400. Shopping around in California gets you a lot less far than the average state. This is because both forces we’ve analyzed are constraining the prices - the state is a “more fair” one, and the median premiums are on the smaller side, compared to the national standard. Florida, by contrast, is an even more “fair” state than California (each $1000 increase in median premium corresponds to about a $275 increase in difference), but the premiums are high enough that the Florida differences are still much higher than the ones in California.
Some states seem to just be intrinsically more fair than other states when it comes to home insurance quotes. However, no matter how fair the state, more expensive locations always means bigger differences between premiums if you shop around. So if you get a home insurance quote and the yearly premium is expensive, you should get a second opinion - you might be able to save thousands of dollars a year.