Home Purchase Approval Rates are Higher than Refinance and Home Improvement Loans in Los Angeles, CA
By: Ramu Garuda July. 18, 2018
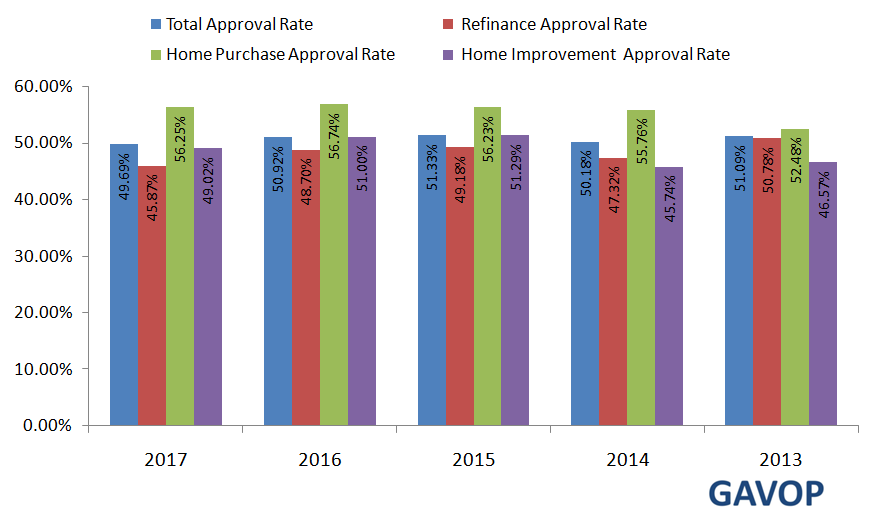
Loan approval rates for the purchase of new homes are higher than refinance and home improvement approval rates in Los Angeles, California. Using the latest statistics from the Home Mortgage Disclosure Act (HMDA), Gavop reported that home purchases have the the highest percentage (55.90 percent) of approved loans as of 2017, followed by 47.05 percent for home improvements and 45.86 percent for refinance approvals.
This report analyzed approval rates in Los Angeles from 2013 to 2017 and found that among the three types of loans, the approval rates for home purchase approval rates were the highest in every year. Further, the home purchase approval rates in Los Angeles were up to 10 percent higher than the national values between 2013 and 2017. Overall, mortgage loans secured by one to four family properties in 2017 increased by 35 percent, that is, from 82,640 in 2013 to 61,403 in 2017
The following graph illustrates the approval rates for each type of loan over a five-year period. It shows that while the numbers varied in recent years the approval rates for home purchases are consistently the highest. In 2015, home improvement approval rates surpassed home refinance approval rates by a significant margin.
Approval Rate Based on Purpose of Loans
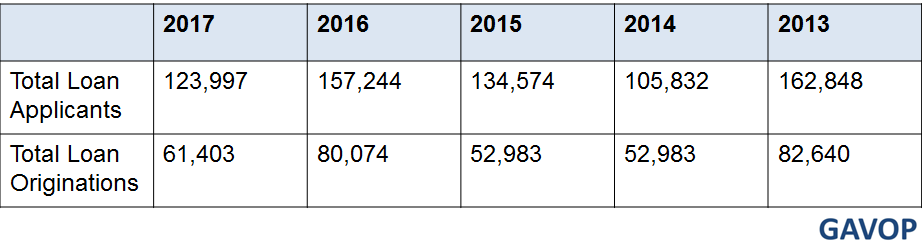
To provide an overview of the total amount of loans processed in Los Angeles, the following table compares total loan applicants with loan originations. In most cases, loan originations refer to all the steps taken by a lender, from receiving an application to the disbursal of funds. Among the studied years, 2013 reports the largest number of loan applications, while 2014 has the lowest. Overall, there has been a decrease in the total number of applicants from 2013 to 2017, resulting in a compound annual growth rate of -5.31 percent.
Total Loan Applicants and Originations by Year in Los Angeles, California
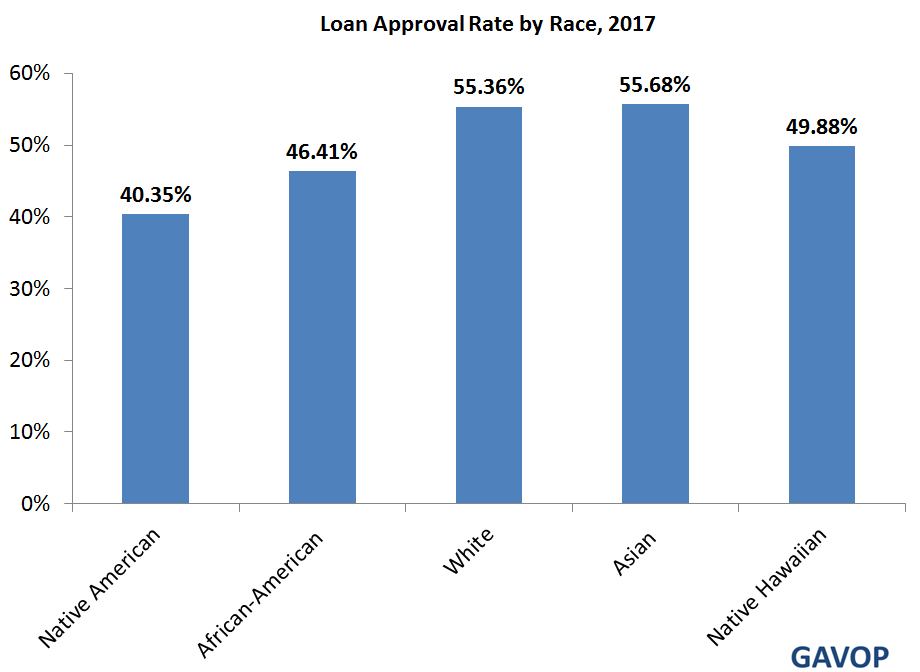
The following figure illustrates the rate of loan approval by race. The data show that a majority of the approvals are for Asians and Whites, while Native Americans have the lowest number of approvals. Among the Asian applicants in Los Angeles, 55.68 percent of loans were approved in 2017. This number was 55.36 percent for Whites, 49.88 percent for Native Hawaiians, 46.41 percent for African-Americans, and 40.35 percent for Native Americans.
ABOUT THE AUTHOR

Ramu Garuda
Ramu is a research analyst with over 9 years of analytics & research experience. Prior to joining the company, he worked with some of the prominent consulting and market research firms in India, including Pride Technology (Supporting consulting projects to PWC), RR Donnelly, and The Hackett Group. His skills include company profiling, benchmarking, data and trend analysis, industry analysis, and report writing across the industries. Ramu holds a Master’s degree in Finance and Marketing. He also has a bachelor’s degree in Biotechnology.