Home Purchase Loans Receive Higher Rates of Approval than Home Improvement and Refinance Loans in Phoenix, AZ
By: Ramu Garuda July. 24, 2018
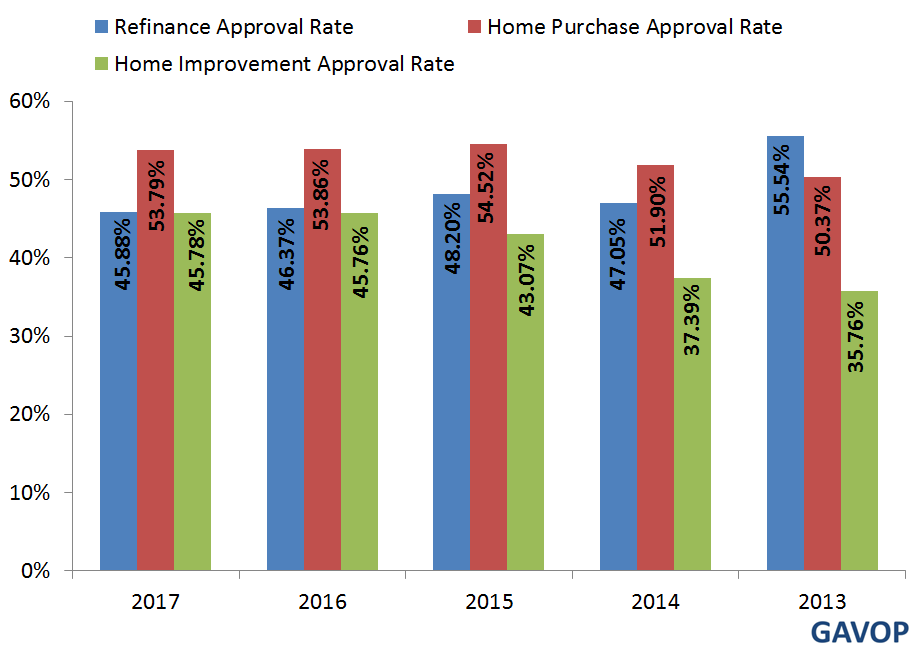
Of people applying for housing-related loans in Phoenix, AZ, those buying new homes have the highest approval rate. In 2017, 53.79% of loan applications for new home purchases were approved, while 45.88% of loan applications for home refinance were approved, and 45.78% home improvement loans were approved.
This information was disclosed in a recent study by Gavop using statistics from the Home Mortgage Disclosure Act (HMDA). The analysis was designed to quantify approval rates in Phoenix, AZ, during the five-year period between 2013 and 2017.
The trend in Phoenix shows that home purchase loans have the highest approval rate, followed by refinance loans and home improvement loans. The following graph presents the data, which show the approval rates of each loan type. The numbers varied between 2013 and 2017, with an unusual pattern observed in 2013.
The data shows that in 2013, refinance loans had a higher approval rate than home purchase loans did (55.54% vs. 50.37%). From 2013 onwards, the gap between refinance and home improvement approval rates began to shrink.
Approval Rate Based on Loan Category
Data from 2013 for Phoenix, AZ, also stands out in comparison to national figures, since in this year, approval rates for refinance and home purchase loans were up to 10% higher than the national figures ,while approvals for home improvement loans were over 10% less than the national values. Then, between 2014 and 2017, the approval rates for all three loan types were 1% to 10% below the national averages.
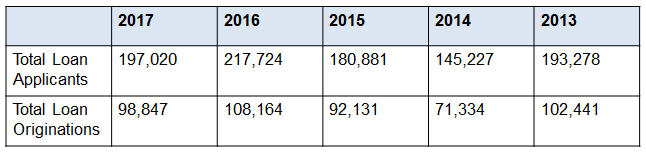
Additional research shows that among the past five years, 2016 had the largest number of loan applicants at 217,724, while 2014 had the lowest number, at 145,227. To provide a sense of the loans processed in Phoenix, the following table compares the total number of loan applicants with loan originations.
Total Number of Loan Applicants and Originations by Year in Phoenix, AZ
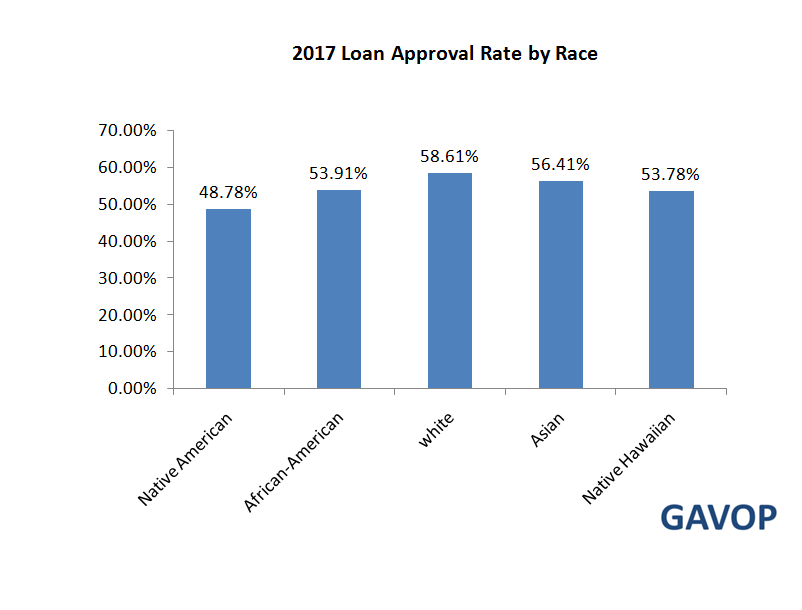
Loan approval rates can further be broken down to approval rates in terms of race. The highest approval rate of 58.61% was recorded for whites, followed by Asians at 56.41%, African-Americans at 53.91%, Native Hawaiians at 53.78%, and Native Americans at 49.78%. These data are shown in the following graph
ABOUT THE AUTHOR

Ramu Garuda
Ramu is a research analyst with over 9 years of analytics & research experience. Prior to joining the company, he worked with some of the prominent consulting and market research firms in India, including Pride Technology (Supporting consulting projects to PWC), RR Donnelly, and The Hackett Group. His skills include company profiling, benchmarking, data and trend analysis, industry analysis, and report writing across the industries. Ramu holds a Master’s degree in Finance and Marketing. He also has a bachelor’s degree in Biotechnology.